Performance Benchmark
Signal allows for top notch performance with minimal GC allocations while delivering the full set of features. (Be aware while debugging signals with the Signal Profiler in the editor, every call will allocate a minimal amount on the heap to provide debugging information)
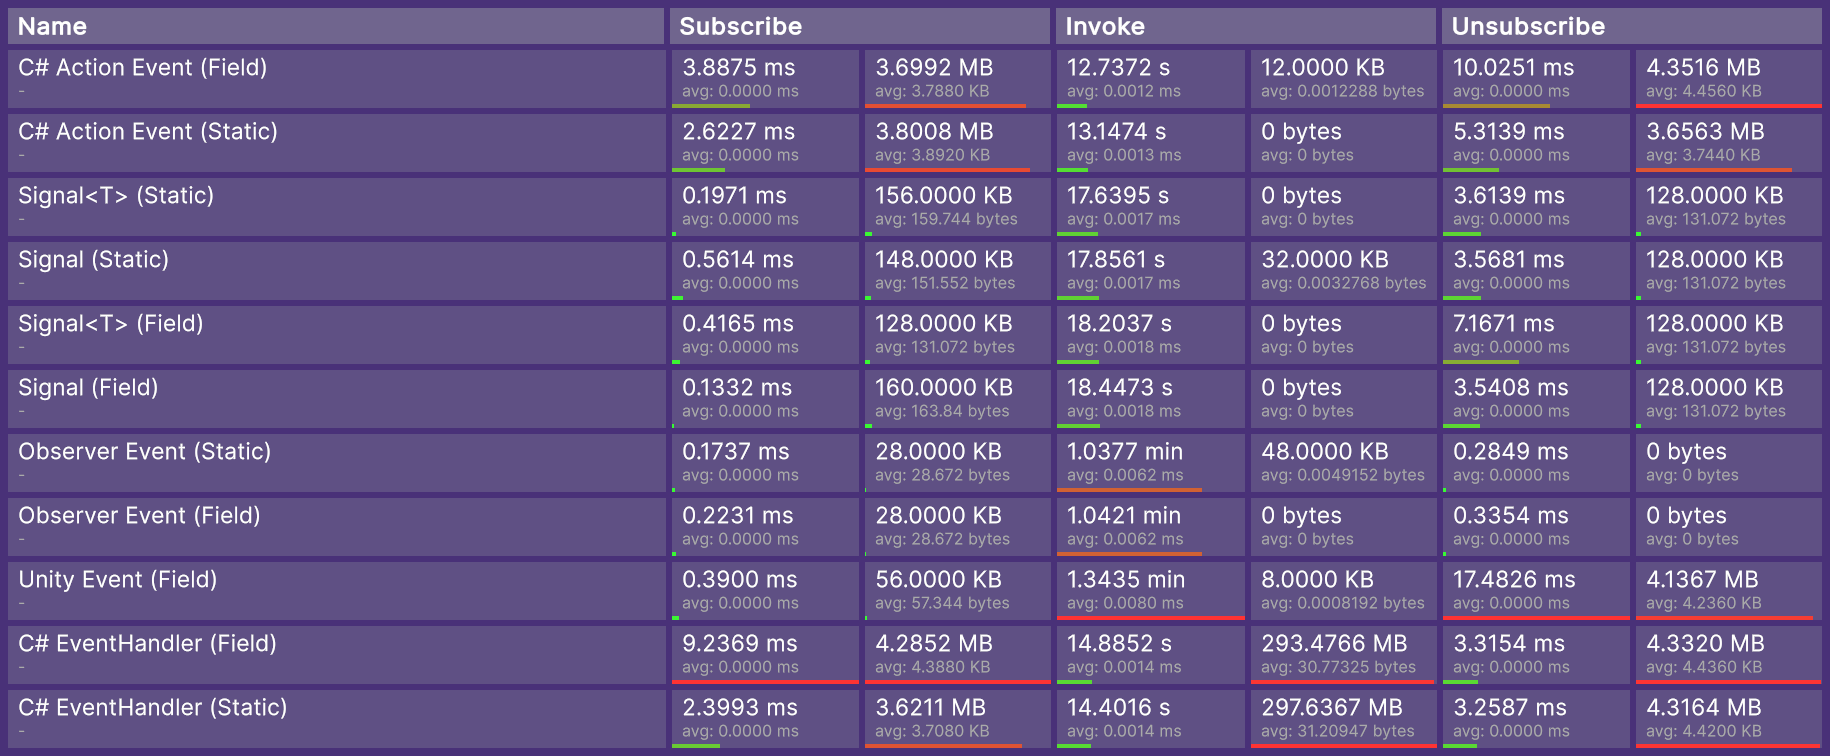
Notes to this Benchmark:
- Tested with 1’000 observers (separate GameObjects), 10’000’000 event invocations on AMD Ryzen 9950X (modern CPU)
- This screenshot is from package version 1.1.0
- Benchmarks with other amounts and/or on other systems resulted in identical results in relation between the different event methods
- Ordered by invoke score (time+gc percentage)
- Be aware: GC pressure when subscribing and unsubscribing from events is not irrelevant but still result in good performance in game (so C# Actions are performance wise not worse than Signals)
- Be aware: The method used to record GC pressure results in unity engine noise to be sampled into the results (both C# Actions, Signals and Observer pattern are Zero Memory allocation invocations)
- Benchmark tooling used is included in the build, can be used to check performance on your own systems or just be deleted like a demo scene.